
How to use Scout
Learn how to access and navigate Scout apps and the reports within them for Catholic Schools (CS), Independent Schools (AIS) and ACT Government and Independent Schools.
Viewing apps and reports
For more information about accessing Scout and receiving support, visit the Scout for non-NSW Department of Education schools webpage.
Scout Apps are essentially folders that contain related reports and information.
Scout Reports are organised within Apps.
Apps can also contain other features, including summary information, useful links and videos. Selecting an app tile will launch the app.
View all apps
When you log into Scout, 'Recommended' apps will appear at the top of the home screen, followed by 'Recently used' apps.
To see all Apps available to you, select the Apps button on the left-hand side of the screen.
Alternatively, you can search for the app in the search bar at the top-centre of the window.

Scout welcome pages
When you launch an app, the default page is the app’s Welcome page.
Welcome pages contain useful information and are divided into three main sections:
- Links to resources and support options
- A brief explanation of the information provided in the app
- A summary of the report categories in the navigation pane

Scout navigation pane
Use the navigation pane on the left of the screen to view all reports within the selected app.
Note that some reports have a down arrow icon in the title, indicating more views or reports within that heading.
Select the down arrow to reveal or hide the options.

Report explanations
Each Scout report will have a link to its own 'Report explanation' in the top navigation bar.
Report explanations provide context about the benefits to users, source of data, instructions on using the report and points to consider when analysing the data.
Slicers enable you to filter a Scout report to different selection criteria.
Using slicers
What are slicers?
Slicers allow you to filter, or ‘slice’, the information in a report to look at a smaller subset of data.
In Scout, slicers are drop-down menus at the top of each report.
Required vs optional slicers
Required slicers are mandatory and require a valid selection for the report to generate.
Required slicers are not the same across all Scout reports, but they will similarly allow for a high-level view of data.
Optional slicers are not required but if chosen will allow you to further drill down to view a subset of data.
For example, you can select a particular student group or a specific class that you teach.
Alternatively, you might want to look at the data for students sliced by Scholastic Year, Gender, Aboriginality, or EAL/D status. Where this information is available, you can use optional slicers to look only at that grouping.
Optional slicers generally default to a selection of All.

Making multiple selections
When using the slicers, you often have the option to multi-select, which means selecting more than one option.
Holding down the control key (CTRL – Windows) or command key (CMD – Mac) while selecting allows you to make multiple selections simultaneously.
The slicer selection field will indicate that you have made multiple selections.
The checkbox indicates that a slicer option has been chosen.

Clearing slicers selections
To clear selections from filters or slicers, select the eraser button that appears when you hover over the slicer.

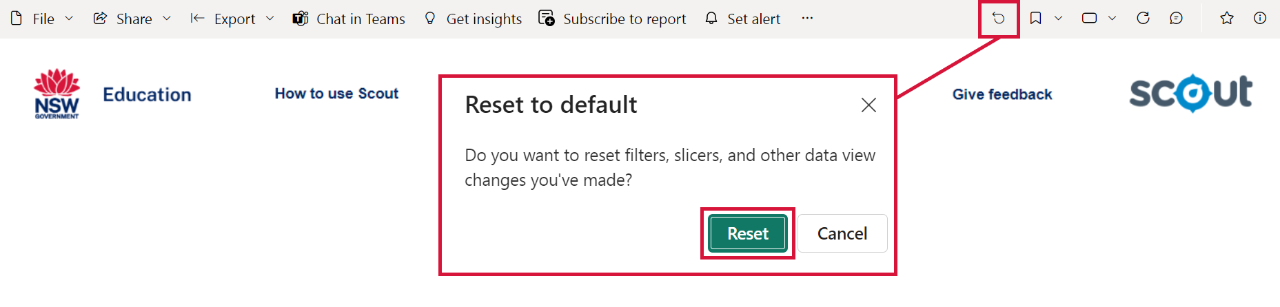
If you wish to remove all your selections and return to the initial view of the report, select the back arrow button in the top right-hand corner of the report, then select ‘Reset’.
Or, if you are in the NAPLAN reports, select the 'Reset all slicers' button next to the slicers.
Note: The system remembers your selections even if you log out and start a new session. Always 'reset' the slicers when opening a Scout report.
VALID reports
NAPLAN reports

If you still cannot see data in your report, please get in touch with your dedicated Scout support team.
A guide on how to interpret charts and tables in Scout reports.
Analysing charts and tables
Scout reports contain various types of charts and tables to help you view data and information in a visually meaningful way and support your understanding of the information in a report.
Hover for more information
Due to the scale of some graphs, it can be difficult to gain a precise understanding of the data.
By hovering over any chart segment, a pop-up box of summary information will appear containing further details about that segment of data.

View as a table
If you prefer to access information in a table format, hover over the top right-hand corner of the graph or chart to reveal an ellipsis (three dots).
Select the ellipsis (...) and then select ‘Show as a table’.
This will take you to a new view, which provides the information in table form.

Cross-highlighting
You can use cross-highlighting to view data subsets, enabling easy comparison across all charts in the report.
The cross-highlighting function is particularly useful in a report with several graphs and/or tables. By identifying a specific focus item on one graph or table, you will see it reflected across the remaining graphs and tables in the report.
Select any column on a chart to trigger cross-highlighting.
To clear your selection, select the item again.
Holding down the control key (ctrl - Windows) or command key (cmd - Mac) on your keyboard allows you to select multiple items to cross-highlight at once.

Vertical scrolling
Some Scout reports contain vertical scrolling, allowing you to access further information within the same report.
You can hover over the scroll bar and use the scrolling function on your mouse, or you can select and hold the grey scroll bar and pull it down to scroll.

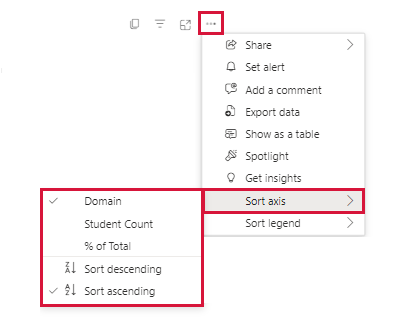
Sorting tables
From the 'More options' menu, select ‘Sort by’ and choose from the different sorting options in the dropdown menu. These may vary depending on the type of chart.
Filter icon
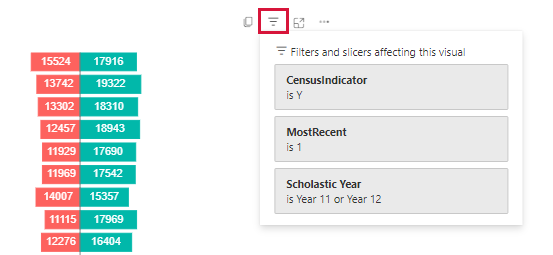
When you hover over charts or tables in Scout, a menu of options will appear on the top right-hand side.
From this menu, hover over the 'Filter' icon to see a list of the chosen filters or slicers affecting that chart or table.
Focus mode
Enlarge individual charts or tables within a report by selecting the ‘Focus mode’ icon on the top-right side of the chart.

Exporting for further analysis
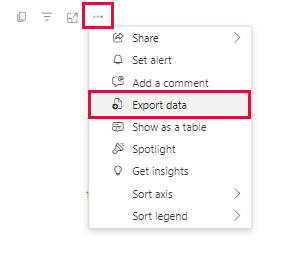
When you hover over a chart or table, select the three dots or ellipsis (...) icon that appears in the top-right corner. This is the ‘More options’ menu.
Select ‘Export data’ to export the selected table to an Excel file. This function is not available on every report.
Scout users have responsibilities when accessing and sharing information found within Scout reports.
Data privacy
Scout contains confidential information, such as student and staff details, that should not be accessed by unauthorised users. It is important to remember to log out of Scout if you are no longer using it or if you walk away from your computer.
This is particularly important if you are viewing reports in a space with students around.
This practice aligns with the Data Privacy responsibilities of all Scout users – ensuring that confidential information, in any form, cannot be accessed by unauthorised people.
For more information, please read the Privacy statement and Scout terms of use.